


Turf Intelligence
Course Health Report
Report date
17 May 2026
Greenwood Golf Club
Reporting period · 21 Apr → 01 May 2026
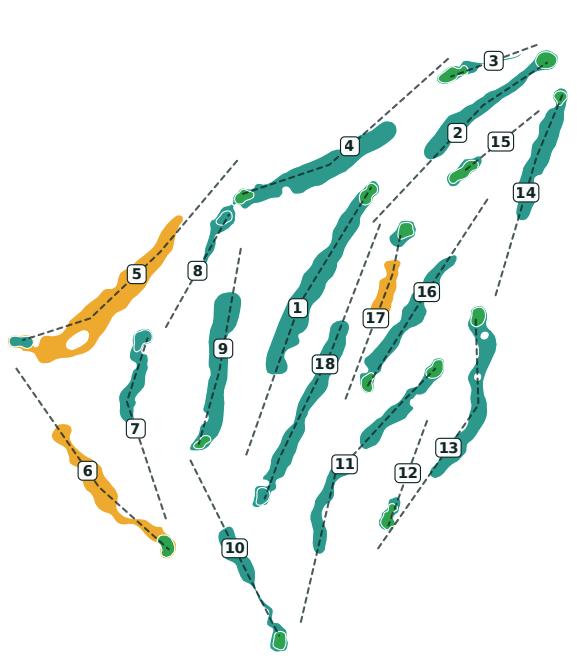
Scanned area
113 996 m²
38 zones · 18 greens · 20 fairways
21 Apr 2026
Moderate conf.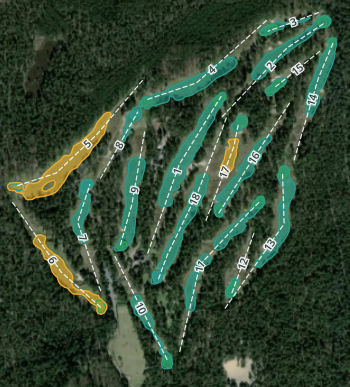
Avg PhytoScore
63/100
7.0pts
Course Δ
01 May 2026
High conf.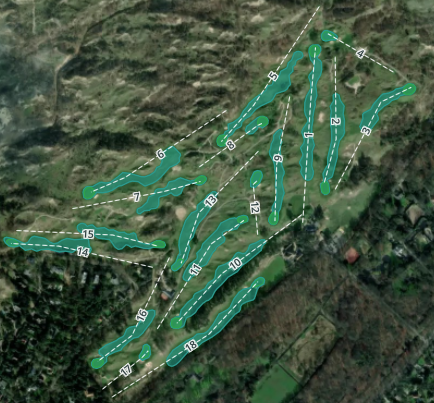
Avg PhytoScore
70/100
PhytoScore
Excellent
85–100
Good
65–84
Monitor
50–64
Stressed
35–49
Critical
<35
Between scans
11 D
Rain
0.4 mm
Peak temp
22.8 °C